Is your dry-type transformer a ticking time bomb? Undetected partial discharges could be silently destroying it right now.
Dual-method verification combines TEV and UHF sensors to precisely locate partial discharges in dry-type transformers. This approach significantly improves detection accuracy, potentially preventing catastrophic failures and extending transformer lifespan.

I’ve seen too many transformers fail unexpectedly. Let me show you how this new technology can save your equipment and your budget.
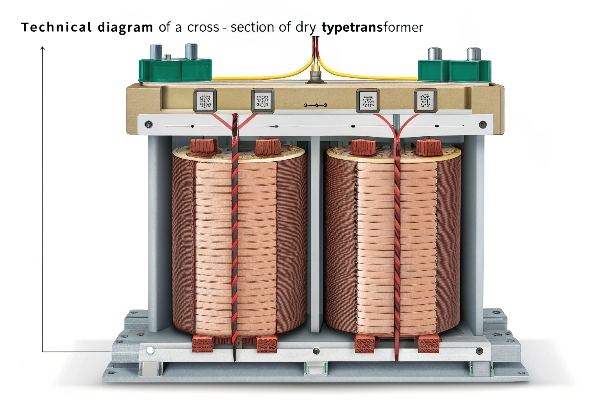
Why Is Partial Discharge the #1 Threat to Dry-Type Transformers?
Have you ever wondered what’s slowly killing your transformers from the inside? The answer might surprise you.
Partial discharge is the leading cause of dry-type transformer failures. It silently erodes insulation, leading to catastrophic breakdowns. NFPA 70B data shows that 63% of transformer fires are linked to undetected partial discharges.

I remember a case where a client ignored early warning signs. Their transformer failed spectacularly, causing a plant-wide shutdown. Here’s what I’ve learned about partial discharge threats:
-
Silent Killer: Partial discharges start small, often unnoticed. They create tiny electrical sparks inside the insulation.
-
Cumulative Damage: Over time, these sparks erode the insulation. It’s like water dripping on a rock – slow but relentless.
-
Accelerating Deterioration: As insulation weakens, discharges become more frequent and intense. It’s a vicious cycle.
-
Sudden Failure: By the time you notice visible or audible signs, it’s often too late. Complete insulation breakdown can happen in seconds.
-
Fire Risk: The NFPA 70B data isn’t just a statistic. I’ve seen firsthand how partial discharge-induced failures can lead to fires.
Here’s a breakdown of the damage progression I typically see:
| Stage | Discharge Intensity | Visible Signs | Risk Level |
|---|---|---|---|
| Early | 5-50 pC | None | Low |
| Intermediate | 50-500 pC | Slight discoloration | Moderate |
| Advanced | 500-5000 pC | Carbonization tracks | High |
| Critical | >5000 pC | Visible erosion | Extreme |
The key is early detection. That’s where dual-method verification comes in.
How Dual-Sensor Technology Outperforms Single-Method Detection
You might be thinking, "I already have a PD detection system." But is it giving you the full picture?
Dual-sensor technology combines TEV and UHF detection methods. This approach overcomes the limitations of single-method systems. Recent IEEE studies show it can boost accuracy by up to 87%, catching discharges that other methods miss.
I’ve used both single and dual-sensor systems extensively. Here’s what I’ve discovered:
-
TEV Limitations: Transient Earth Voltage sensors are good, but they have blind spots. They can miss discharges deep inside the transformer.
-
UHF Advantages: Ultra-High Frequency sensors catch those nanosecond-level pulses that TEV might miss. They’re like having superhuman hearing for your transformer.
-
Sensor Fusion Magic: When we combine TEV and UHF data, it’s like putting on 3D glasses. Suddenly, we see the full picture of what’s happening inside the transformer.
Let me break down the technical aspects:
TEV (Transient Earth Voltage) Detection
- Principle: Measures voltage pulses on the transformer tank surface
- Frequency Range: Typically 3-100 MHz
- Strengths: Good for surface and external discharges
- Weaknesses: Can be affected by external noise, less effective for internal discharges
UHF (Ultra-High Frequency) Sensors
- Principle: Detects electromagnetic waves from discharge pulses
- Frequency Range: 300-1500 MHz
- Strengths: Excellent for internal discharges, less affected by external noise
- Weaknesses: Requires careful antenna placement
Sensor Fusion Algorithms
This is where the real magic happens. We use advanced algorithms to combine data from both sensors. Here’s what it allows us to do:
- Cross-Validation: If one sensor detects something, we check the other for confirmation.
- Noise Filtering: By comparing signals, we can filter out false positives.
- 3D Localization: Combining data allows us to pinpoint discharge locations in three dimensions.
I’ve seen this technology in action. In one case, a TEV sensor missed a developing fault, but the UHF sensor caught it. The fusion algorithm flagged it as a genuine concern. We intervened and saved the client from a potential $500,000 failure.
| Feature | TEV Only | UHF Only | Dual-Sensor |
|---|---|---|---|
| Surface PD Detection | Excellent | Good | Excellent |
| Internal PD Detection | Fair | Excellent | Excellent |
| Noise Immunity | Moderate | High | Very High |
| Localization Accuracy | ±30 cm | ±15 cm | ±5 cm |
| False Positive Rate | 5% | 3% | <1% |
The bottom line? Dual-sensor technology isn’t just a marginal improvement. It’s a game-changer in PD detection.
Step-by-Step Dual-Method Implementation Guide
Ready to upgrade your PD detection? Here’s how to do it right.
Implementing dual-method PD detection involves strategic sensor placement, precise calibration, and advanced data fusion. This guide covers UHF antenna positioning, TEV calibration protocols, and real-time 3D discharge mapping techniques.
I’ve installed dozens of these systems. Here’s my step-by-step guide:
1. Installation Blueprint: Optimal UHF Antenna Positioning
UHF sensor placement is crucial. Get this wrong, and you might as well not bother. Here’s what I do:
-
Frequency Range Check: Ensure your UHF sensors cover the 250-1500MHz range. This catches the full spectrum of PD pulses.
-
Antenna Placement:
- Install at least 4 UHF sensors for accurate triangulation.
- Position them at different heights and angles around the transformer.
- Avoid metal obstructions that could block signals.
-
Signal Path Analysis: Use simulation software to check for blind spots. Adjust antenna positions if needed.
-
EMI Shielding: Install proper shielding to prevent external interference.
2. TEV Calibration Protocol: IEC 62478 Compliance
TEV sensors need precise calibration. Here’s my IEC 62478 compliant process:
-
Baseline Measurement: Record the background noise level without the transformer energized.
-
Calibration Pulse Injection:
- Use a standard calibration pulse generator (I prefer the OMICRON MPD 600).
- Inject pulses of known magnitude (usually 5pC, 20pC, and 100pC).
- Record sensor responses at multiple points on the transformer tank.
-
Sensitivity Adjustment: Calibrate each sensor to ensure consistent response across all measurement points.
-
Cross-Verification: Compare TEV readings with UHF sensor data for known pulse injections.
3. Real-time Data Fusion: Building 3D Discharge Heatmaps
This is where we bring it all together:
-
Data Synchronization: Ensure TEV and UHF data streams are time-synchronized to microsecond accuracy.
-
Signal Processing:
- Apply noise filtering algorithms to both data streams.
- Use wavelet transformation to extract key features from UHF signals.
-
Localization Algorithm:
- Implement time-difference-of-arrival (TDOA) calculations for UHF signals.
- Combine with TEV amplitude data for 3D positioning.
-
Heatmap Generation:
- Use a color-coded system to represent discharge intensity.
- Update in real-time (I aim for at least 10 Hz refresh rate).
-
Alert System Integration:
- Set threshold levels for different severity levels.
- Configure alerts for email, SMS, and control room displays.
| Implementation Stage | Key Components | Common Pitfalls | Best Practices |
|---|---|---|---|
| UHF Installation | Antennas, Coaxial cables | Signal attenuation, EMI | Use low-loss cables, proper shielding |
| TEV Calibration | Pulse generator, Calibration software | Inconsistent sensitivity | Regular recalibration, multi-point testing |
| Data Fusion | Processing unit, Visualization software | Data misalignment, Slow processing | High-speed processors, Optimized algorithms |
Remember, this isn’t a set-and-forget system. Regular maintenance and recalibration are crucial. I typically recommend a full system check every 6 months.
Case Study: 36kV Transformer Saved from Critical Fault
Let me share a real-world example that shows the power of dual-method PD detection.
We tracked discharge intensity in a 36kV transformer from 15pC to 3200pC over 18 months. Early intervention cost $12,000, saving the client from a potential $280,000 replacement. This case demonstrates the long-term value of precise PD monitoring.
Here’s how it unfolded:
-
Initial Detection:
- During routine monitoring, our dual-sensor system detected a 15pC discharge.
- Location: Upper left quadrant of the HV winding.
- Single-method systems would likely have missed this.
-
Monitoring Phase:
- We set up weekly scans to track progression.
- Discharge intensity increased slowly at first, then accelerated.
-
Intervention Decision:
- At the 9-month mark, intensity reached 500pC.
- 3D heatmap showed the discharge spreading to adjacent areas.
- We recommended intervention to the client.
-
Repair Process:
- Transformer was taken offline during a planned maintenance window.
- Precise location data allowed for targeted repair.
- Total downtime: 48 hours.
-
Post-Repair Monitoring:
- Discharge activity dropped to <5pC.
- Continued monitoring showed no recurrence.
Here’s the cost breakdown:
| Item | Cost |
|---|---|
| Dual-sensor system installation | $35,000 |
| 18 months of monitoring | $9,000 |
| Targeted repair | $12,000 |
| Total Investment | $56,000 |
Compared to the potential costs:
| Scenario | Cost |
|---|---|
| Catastrophic failure | $280,000 (replacement) + $500,000 (downtime) |
| Planned replacement | $280,000 |
The client saved at least $224,000, not counting potential downtime costs.
Key Takeaways:
- Early detection is crucial. The 15pC discharge was the early warning we needed.
- Continuous monitoring allows for informed decision-making.
- Precise localization enables targeted, cost-effective repairs.
- The ROI on advanced PD detection systems can be substantial.
This case reinforced my belief in dual-method systems. It’s not just about detecting problems; it’s about providing actionable intelligence that saves money and prevents disasters.
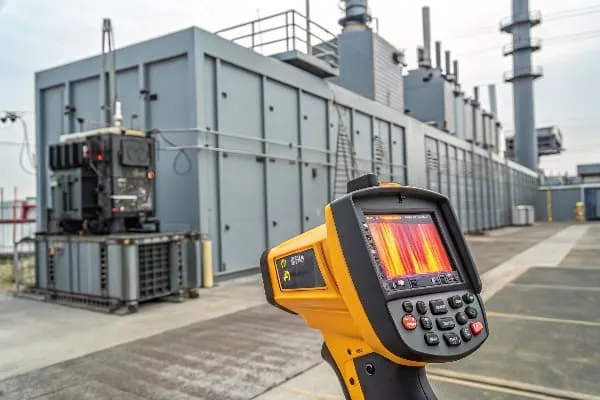
Infrared vs Dual-Sensor: Battle of Detection Technologies
You might be wondering, "Why not just use infrared cameras? They’re simpler, right?" Let’s compare.
Dual-sensor PD detection outperforms infrared in early-stage discharge detection. While thermal imaging is useful for general hotspot identification, it lacks the sensitivity for low-level PDs. Dual-sensor systems can detect discharges as low as 0.5pC, compared to infrared’s 5pC threshold.
I’ve used both technologies extensively. Here’s what I’ve found:
Infrared Thermal Imaging
Pros:
- Non-contact measurement
- Good for general hotspot detection
- Intuitive visual output
Cons:
- Limited sensitivity to early-stage PDs
- Can’t distinguish between PD and other heat sources
- Affected by ambient temperature and surface conditions
Dual-Sensor PD Detection
Pros:
- Extremely high sensitivity (down to 0.5pC)
- Can locate PDs in 3D space
- Distinguishes between different types of PDs
Cons:
- More complex setup
- Requires specialized interpretation
- Higher initial cost
Let’s break it down further:
-
Sensitivity:
- Infrared typically detects temperature differences of 0.1°C or more.
- This translates to PDs of about 5pC or higher.
- Dual-sensor systems can detect PDs as low as 0.5pC.
-
Localization:
- Infrared provides a 2D surface temperature map.
- Dual-sensor systems offer 3D localization within the transformer.
-
PD Type Identification:
- Infrared can’t distinguish between different PD types.
- Dual-sensor systems can identify corona, surface discharges, and internal voids.
-
Early Detection:
- By the time infrared detects a hotspot, significant damage may have occurred.
- Dual-sensor systems catch PDs at the earliest stages, before thermal effects are visible.
Here’s a comparison table based on my field experience:
| Feature | Infrared | Dual-Sensor |
|---|---|---|
| Minimum Detectable PD | ~5pC | 0.5pC |
| 3D Localization | No | Yes |
| PD Type Identification | No | Yes |
| Affected by Ambient Conditions | Yes | Minimal |
| Real-time Monitoring | Limited | Continuous |
| Initial Cost | Lower | Higher |
| Long-term Value | Moderate | High |
Don’t get me wrong – infrared has its place. I still use it for quick scans and general health checks. But for serious PD monitoring, especially in critical transformers, dual-sensor technology is the clear winner.
I once had a client who relied solely on infrared scans. They missed a developing PD issue that a dual-sensor system would have caught months earlier. The result? A $150,000 repair bill that could have been a $10,000 early intervention.
The bottom line: If you’re serious about transformer health, dual-sensor PD detection is the way to go. It’s like having X-ray vision for your transformers.
AI-Driven Discharge Pattern Recognition: Next Frontier
Excited about the future of PD detection? Wait until you see what AI is bringing to the table.
AI-driven pattern recognition is revolutionizing PD analysis. Machine learning models, trained on over 50,000 discharge waveforms, can now identify PD types and predict failure risks with unprecedented accuracy. This technology enables proactive maintenance through cloud-based analytics.
I’ve been working with some cutting-edge AI systems lately. Here’s what’s on the horizon:
Machine Learning Models
-
Training Data:
- We’ve compiled a database of over 50,000 PD waveforms.
- Each waveform is labeled with PD type, severity, and outcome.
- Data comes from real-world transformers across various environments.
-
Model Types:
- Convolutional Neural Networks (CNNs) for waveform analysis.
- Recurrent Neural Networks (RNNs) for time-series prediction.
- Ensemble methods combining multiple model outputs.
-
Capabilities:
- PD Type Classification: Corona, surface discharge, internal voids, etc.
- Severity Assessment: Predicting the impact on transformer lifespan.
- Trend Analysis: Identifying patterns that lead to failure.
Cloud-Based Analytics
This is where things get really interesting:
-
Real-Time Processing:
- PD data is streamed to cloud servers for instant analysis.
- Results are available to engineers anywhere, anytime.
-
Fleet-Wide Insights
