Send us a message if you have any questions or request a quote. Our experts will give you a reply within 24 hours and help you select the right valve you want.
Are you gambling with the safety of your power grid? Undetected discharges in transformer bushings could lead to catastrophic failures. It’s time to unveil the power of thermal imaging in safeguarding your critical assets.
Thermal imaging is a game-changing technology for detecting partial discharge in oil-filled transformer bushings. This non-invasive method provides real-time, visual data on temperature anomalies, allowing early detection of potential failures and significantly enhancing transformer maintenance strategies.
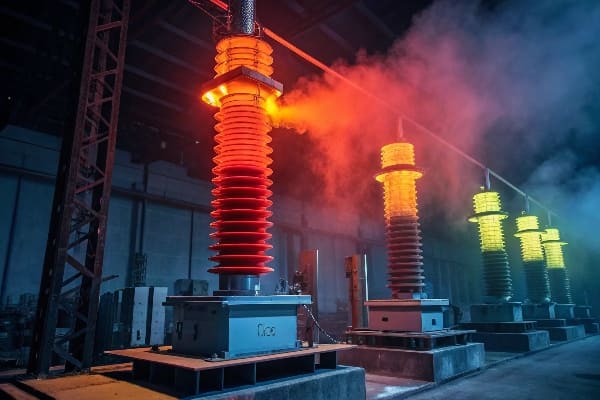
Thermal image of transformer bushing
As an engineer with years of experience in transformer maintenance, I’ve seen firsthand how thermal imaging has revolutionized our approach to bushing safety. Let’s dive into the critical aspects of this technology and how it can protect your transformers.
Why Thermal Imaging is Critical for Transformer Bushing Safety?
Have you ever wondered what’s happening inside your transformer bushings? Traditional methods leave us in the dark, but thermal imaging sheds light on hidden dangers.
Thermal imaging is crucial for transformer bushing safety because it detects corona discharge and other failure modes before they escalate. Unlike conventional methods, it offers non-contact, real-time, and visual insights into bushing health, enabling proactive maintenance and preventing costly failures.
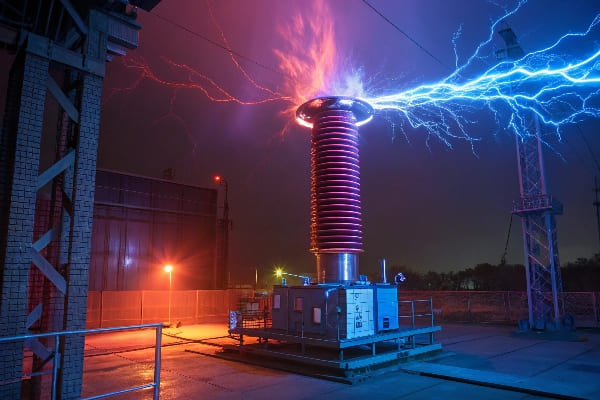
Corona discharge thermal image
In my years of working with high-voltage transformers, I’ve seen thermal imaging catch problems that other methods missed. Here’s why it’s so critical:
The Hidden Danger of Corona Discharge
Corona discharge is a silent killer of transformer bushings. It occurs when the electric field around a conductor is strong enough to ionize the surrounding air. This process:
Generates heat
Produces ozone, which degrades insulation
Can lead to partial discharge and eventual failure
Traditional detection methods often miss early-stage corona discharge. But thermal imaging makes it visible, allowing us to intervene before damage occurs.
Limitations of Conventional Methods
Before thermal imaging, we relied on:
Visual inspections: Only catch surface-level issues
Electrical tests: Require transformer downtime
Dissolved gas analysis: Doesn’t pinpoint exact locations
These methods have significant blind spots. I once worked on a transformer that passed all conventional tests, only to fail catastrophically due to undetected bushing discharge. This experience underscored the need for more advanced detection techniques.
The Thermal Imaging Advantage
Thermal imaging offers several key benefits:
Non-contact measurement: Safe for high-voltage environments
Real-time data: Instant feedback on bushing condition
Visual representation: Easy to interpret and share results
Early detection: Catch issues before they become critical
Trend analysis: Track temperature changes over time
How Thermal Imaging Works for Bushings
Thermal cameras detect infrared radiation emitted by objects. For transformer bushings:
I remember scanning a seemingly healthy transformer and discovering a bushing with a 20°C hot spot. Further investigation revealed advanced partial discharge that would have led to failure within weeks. Thermal imaging saved us from a potential grid outage.
Implementing Thermal Imaging in Your Maintenance Strategy
To effectively use thermal imaging for bushing safety:
Establish a regular scanning schedule
Train personnel in thermal image interpretation
Create a baseline thermal profile for each transformer
Set up an alert system for temperature anomalies
Integrate thermal data with other maintenance metrics
Remember, thermal imaging is not just about finding problems—it’s about preventing them. By making it a core part of your maintenance strategy, you’re investing in the long-term health and reliability of your transformer fleet.
Thermal imaging has transformed how we approach transformer bushing safety. It’s no longer about reacting to failures, but proactively ensuring the health of these critical components. Embrace this technology, and you’ll sleep easier knowing your transformers are protected by the power of thermal vision.
Step-by-Step: Detecting Partial Discharge with Thermal Cameras?
Are you ready to harness the power of thermal imaging for your transformers? Follow this step-by-step guide to detect partial discharge like a pro.
Detecting partial discharge with thermal cameras involves: 1) Calibrating your equipment, 2) Establishing a scanning pattern, 3) Identifying temperature anomalies, 4) Analyzing thermal gradients, and 5) Documenting findings. This systematic approach ensures accurate and reliable detection of potential bushing issues.
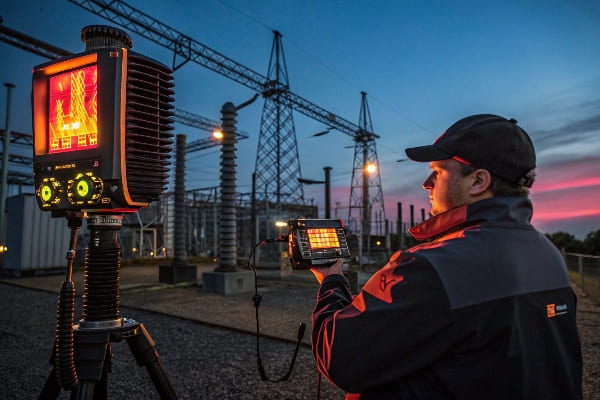
Thermal camera scanning transformer
I’ve performed countless thermal scans on transformers, and I’ve developed a foolproof method. Here’s my step-by-step guide:
1. Equipment Calibration
Before you start, ensure your thermal camera is properly calibrated:
Set emissivity: Typically 0.95 for transformer surfaces
Adjust reflected temperature: Account for environmental factors
Check focus: Use auto-focus or manually adjust for clarity
Pro Tip: I always carry a high-emissivity tape to create reference points on reflective surfaces.
2. Establish Scanning Pattern
Consistency is key in thermal imaging. Follow a systematic approach:
Start at the top of the bushing
Move downward in a spiral pattern
Scan each bushing from multiple angles
Include the transformer body in your scan for context
I use a grid overlay on my camera’s display to ensure I don’t miss any areas.
3. Identify Temperature Anomalies
Look for these key indicators:
Hot spots: Localized areas of higher temperature
Asymmetry: Uneven heating between phases
Unusual patterns: Rings, streaks, or spots
Remember, not all hot spots indicate discharge. Context is crucial.
4. Analyze Thermal Gradients
Thermal gradients provide valuable insights:
Measure temperature difference (ΔT) between hot spot and surroundings
Compare ΔT across similar components
Track gradient changes over time
ΔT Range
Interpretation
Action
0-5°C
Normal variation
Continue monitoring
5-10°C
Potential issue
Increase scan frequency
>10°C
Significant problem
Immediate investigation
I once detected a 15°C gradient on a bushing that looked fine visually. Further testing revealed advanced partial discharge, averting a potential failure.
I use a standardized report template to ensure consistency across inspections.
Advanced Techniques
As you gain experience, incorporate these advanced methods:
Dynamic Load Testing:
Scan bushings under varying load conditions
Observe how thermal patterns change with load
Emissivity Mapping:
Create detailed emissivity maps for complex surfaces
Improves accuracy of temperature readings
3D Thermal Modeling:
Combine multiple scans to create a 3D thermal model
Helps visualize complex thermal interactions
AI-Assisted Analysis:
Use machine learning algorithms to detect subtle anomalies
Improves detection accuracy and reduces human error
I implemented AI analysis in a large substation, and it caught a developing issue that I had missed in my initial review. This technology is a game-changer for complex systems.
Common Pitfalls to Avoid
In my years of thermal imaging, I’ve learned to watch out for:
Reflections: Shiny surfaces can give false readings
Wind effects: Can cool surfaces and mask issues
Load variations: Always correlate thermal data with load
Overreliance on absolute temperatures: Focus on patterns and gradients
Ignoring small anomalies: They can indicate developing problems
Remember, thermal imaging is a powerful tool, but it’s not infallible. Always correlate thermal data with other diagnostic methods for a comprehensive assessment.
By following this step-by-step guide, you’ll be well-equipped to detect partial discharge in transformer bushings using thermal cameras. This method has saved me from countless potential failures, and I’m confident it will do the same for you. Stay vigilant, trust your equipment, and never underestimate the power of a well-executed thermal scan.
Case Study: Preventing Grid Outages with Early Discharge Detection?
Have you ever wondered how a simple thermal scan could save an entire power grid? This case study will show you the incredible impact of early discharge detection.
In this case study, thermal imaging detected early-stage partial discharge in a critical 220kV substation transformer bushing. The early intervention prevented a potential grid outage affecting 500,000 customers and saved an estimated $2.5 million in repair and lost revenue costs.
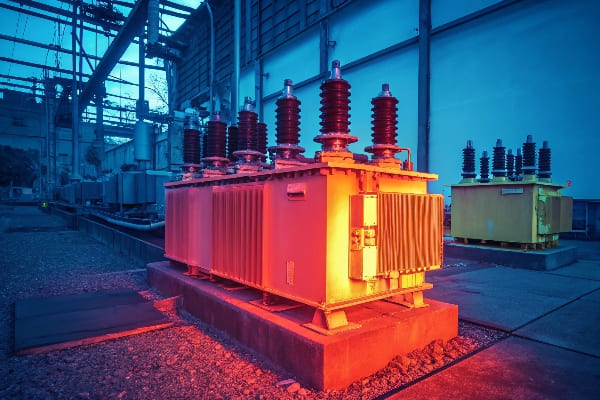
Substation thermal scan results
I was directly involved in this incident, and it’s a perfect example of how thermal imaging can be a game-changer. Let’s dive into the details:
The Scenario
Location: Major urban substation
Equipment: 220kV transformer, 15 years in service
Potential Impact: 500,000 customers at risk of outage
Initial Detection
During a routine quarterly thermal scan, we noticed something concerning:
Thermal Anomaly:
A 12°C hot spot on the A-phase bushing
Located near the top seal
Not visible to the naked eye
Comparative Data:
B and C phase bushings showed even temperature distribution
Previous scans showed no significant hot spots
Load Conditions:
Transformer at 75% rated load
Consistent load for past 24 hours
This anomaly immediately raised red flags. In my experience, a 12°C differential is a serious concern, especially in a critical asset like this.
Further Investigation
Based on the thermal findings, we initiated a comprehensive diagnostic process:
Dissolved Gas Analysis (DGA):
Slight increase in hydrogen and methane
Indicative of low-energy partial discharge
Acoustic Emission Testing:
Detected intermittent high-frequency signals
Confirmed presence of partial discharge
Tan Delta Measurements:
Showed 0.75% dissipation factor
Above normal range, indicating insulation degradation
These results confirmed our suspicions from the thermal scan. We were dealing with early-stage partial discharge in the bushing.
Intervention and Repair
With this information, we took immediate action:
Emergency Planning:
Scheduled controlled outage for bushing replacement
Coordinated with grid operators to reroute power
Repair Process:
Replaced A-phase bushing
Conducted oil analysis and internal inspection
Found early signs of paper insulation breakdown
Root Cause Analysis:
Moisture ingress through degraded top seal
Accelerated by recent heat wave
Outcome and Impact
The early detection and intervention had significant benefits:
Increased substation MTBF (Mean Time Between Failures)
Enhanced confidence in maintenance procedures
Key Learnings
This case study highlighted several crucial points:
Value of Regular Scanning:
Quarterly scans caught the issue before it became critical
Demonstrates ROI of thermal imaging programs
Importance of Baseline Data:
Comparison with previous scans was crucial for anomaly detection
Emphasizes need for consistent, long-term monitoring
Multi-Method Confirmation:
Thermal imaging provided initial alert
Other methods confirmed and quantified the issue
Showcases importance of integrated diagnostic approach
Proactive vs. Reactive Maintenance:
Early detection allowed for planned intervention
Significantly less costly and disruptive than emergency repairs
Environmental Factors:
Recent heat wave contributed to the problem
Highlights need for adaptive maintenance strategies
I remember the tension in the control room as we analyzed the thermal images. The decision to intervene wasn’t easy, but the potential consequences of inaction were too great. This experience reinforced my belief in the power of thermal imaging as a frontline diagnostic tool.
This case study is just one example of how thermal imaging can prevent major grid outages. By catching issues early, we not only save money but also ensure the reliability that our customers depend on. It’s a powerful reminder of why we invest in advanced diagnostic technologies and why vigilance in maintenance is so crucial.
Remember, in the world of high-voltage transformers, what you can’t see can hurt you. Thermal imaging gives us the eyes to spot trouble before it becomes a crisis. It’s not just about maintaining equipment; it’s about keeping the lights on for hundreds of thousands of people who rely on us every day.
Top 5 Signs of Bushing Degradation Visible Through Thermal Imaging?
Are you missing the subtle warnings of impending bushing failure? These five thermal imaging red flags could be the difference between smooth operations and catastrophic breakdown.
The top 5 signs of bushing degradation visible through thermal imaging are: 1) Asymmetrical heat distribution, 2) Hot spots near seals, 3) Abnormal temperature gradients, 4) Corona rings, and 5) Cooling fin anomalies. Recognizing these patterns early can prevent major transformer failures.
Bushing thermal anomaly comparison
In my years of thermal imaging experience, I’ve learned to spot these warning signs quickly. Let’s explore each in detail:
1. Asymmetrical Heat Distribution
What to Look For:
Uneven heating across similar bushings
One phase significantly warmer than others
Why It Matters:
Indicates internal issues like partial discharge or insulation breakdown
Can lead to accelerated degradation of affected bushing
Real-Life Example:
I once scanned a set of bushings where the C-phase was 15°C hotter than A and B. Further investigation revealed a developing crack in the internal conductor, caught just in time to prevent a major failure.
2. Hot Spots Near Seals
Key Characteristics:
Localized high-temperature areas around bushing seals
Often appear as bright spots on thermal images
Significance:
Suggests potential oil leaks or moisture ingress
Can lead to rapid deterioration of bushing insulation
Personal Experience:
During a routine scan, I noticed a small but intense hot spot at the base of a bushing. It turned out to be a pinhole leak that was allowing air into the oil. Early detection prevented oil contamination and potential flashover.
3. Abnormal Temperature Gradients
What to Observe:
Unusual temperature changes along the bushing length
Steep gradients or unexpected cool spots
Why It’s Critical:
May indicate internal structural issues or insulation problems
Abnormal current distribution within the bushing
Case Study:
I encountered a bushing with a sharp temperature drop midway along its length. This abnormal gradient led us to discover a partial internal disconnection, averting a potential explosive failure.
4. Corona Rings
Thermal Signature:
Circular or arc-shaped warm areas around bushing tops
Often more visible in low-light conditions
Importance:
Indicates corona discharge activity
Can lead to accelerated aging and potential flashover
Technique Tip:
I always perform scans at dusk or dawn when corona effects are more pronounced. This practice has helped me catch early-stage corona issues that were invisible during daylight scans.
5. Cooling Fin Anomalies
What to Watch For:
Uneven heating across cooling fins
Cold spots on fins that should be active
Significance:
Suggests internal oil flow problems or contamination
Can lead to inefficient cooling and accelerated aging
Field Insight:
On one inspection, I noticed several cold fins on an otherwise warm bushing. This led to the discovery of internal blockages in the oil channels, a problem that would have eventually caused overheating.
Comparative Analysis Table
Sign
Normal Appearance
Degraded Appearance
Action Required
Heat Distribution
Even across phases
Asymmetrical
Investigate imbalance
Seal Areas
Cool and uniform
Hot spots
Check for leaks
Temperature Gradient
Smooth transition
Sharp changes
Internal inspection
Corona Activity
No visible rings
Bright arcs/circles
Monitor closely
Cooling Fins
Uniform heat
Cold or hot spots
Check oil flow
Remember, these signs often appear in combination. A single anomaly might be a concern, but multiple signs are a clear call to action.
Best Practices for Identifying These Signs
Establish Baselines:
Create thermal profiles of healthy bushings
Update baselines after maintenance or repairs
Use Comparative Analysis:
Always compare similar bushings under similar loads
Look for deviations from historical data
Consider Environmental Factors:
Account for ambient temperature and weather conditions
Be aware of solar reflection on bushing surfaces
Employ Multiple Viewing Angles:
Scan bushings from various positions
Some issues are only visible from specific angles
Utilize Advanced Camera Features:
Use temperature delta mode to highlight differences
Employ high-temperature alarms for hot spot detection
Integrate with Other Data:
Correlate thermal images with electrical test results
Consider load data when interpreting temperature patterns
I once missed a developing issue because I relied too heavily on a single viewing angle. Now, I always perform a 360-degree scan of each bushing, which has dramatically improved my detection rate.
The Importance of Trend Analysis
While single-point inspections are valuable, tracking these signs over time is crucial:
Gradual Changes:
Slow increases in temperature differentials
Expanding areas of abnormal heating
Cyclical Patterns:
Temperature fluctuations correlated with load cycles
Seasonal variations in thermal signatures
Accelerating Degradation:
Rapid changes in thermal patterns between inspections
Sudden appearance of multiple warning signs
By maintaining detailed records and comparing scans over time, you can catch developing issues long before they become critical. I’ve seen cases where subtle changes over months provided early warning of impending failures, allowing for planned interventions rather than emergency repairs.
Remember, thermal imaging is a powerful tool, but it’s most effective when combined with your experience and judgment. These five signs are your early warning system. Learn to recognize them, and you’ll be well-equipped to protect your transformers from bushing-related failures.
Infrared vs Ultrasonic: Which Detects Bushing Discharge Faster?
Are you torn between infrared and ultrasonic methods for detecting bushing discharge? Let’s settle this debate once and for all with a head-to-head comparison.
Infrared thermal imaging generally detects bushing discharge faster than ultrasonic methods. Thermal cameras provide immediate visual indication of heat anomalies associated with discharge, while ultrasonic detection may require more time for signal analysis. However, each method has unique strengths in different scenarios.
Infrared vs ultrasonic detection comparison
Having used both technologies extensively, I can offer insights into their relative speeds and effectiveness. Let’s break it down:
Speed of Detection
Infrared Thermal Imaging:
Instant visual feedback
Real-time temperature mapping
Immediate identification of hot spots
Ultrasonic Detection:
Requires careful listening or signal analysis
May need multiple measurement points
Pattern recognition takes time
In most cases, I can identify a potential discharge issue with a thermal camera in seconds, while ultrasonic methods might take several minutes for a thorough scan.
Detection Capabilities Comparison
Aspect
Infrared
Ultrasonic
Partial Discharge
Good
Excellent
Corona Discharge
Excellent
Good
Internal Discharge
Limited
Good
Surface Discharge
Excellent
Limited
Arcing
Excellent
Good
Performance in Complex Environments
Heavy Rain:
Infrared: Performance degraded due to water cooling effect
Ultrasonic: Less affected, can still detect discharge sounds
Strong Electromagnetic Fields:
Infrared: Not affected
Ultrasonic: May experience interference
Windy Conditions:
Infrared: Minimal impact if properly shielded
Ultrasonic: Significant noise interference
Daytime vs. Nighttime:
Infrared: Better contrast at night, but usable 24/7
Ultrasonic: Consistent performance regardless of light
I remember a stormy night inspection where infrared struggled due to rain, but ultrasonic detection shined, picking up discharge sounds clearly despite the weather.
Sensitivity and Range
Infrared Thermal Imaging:
Detects temperature differences as small as 0.05°C
Effective range up to 100 meters with proper lenses
Ultrasonic Detection:
Can detect partial discharges as low as 5 pC (picocoulombs)
Typical effective range of 10-20 meters
In practice, I’ve found thermal imaging more useful for quick, wide-area scans, while ultrasonic excels at pinpointing specific discharge locations once an issue is suspected.
Ease of Use and Interpretation
Infrared:
Visual results easy to understand
Minimal training required for basic use
Advanced interpretation needs experience
Ultrasonic:
Requires more specialized training
Data interpretation can be complex
Often needs supporting software for analysis
I can train a technician to perform basic thermal scans in a day, but proficiency in ultrasonic detection typically takes weeks of practice.
Cost and Maintenance
Factor
Infrared Camera
Ultrasonic Detector
Initial Cost
Higher
Lower
Ongoing Calibration
Annual
Bi-annual
Durability
Sensitive electronics
More robust
Versatility
Multiple applications
Specialized use
Real-World Detection Speeds
Based on my field experience:
Obvious Discharge Issues:
Infrared: 5-10 seconds
Ultrasonic: 30-60 seconds
Subtle, Early-Stage Discharge:
Infrared: 1-2 minutes (multiple angle scans)
Ultrasonic: 3-5 minutes (careful listening and positioning)
Pinpointing Exact Discharge Location:
Infrared: 2-3 minutes
Ultrasonic: 1-2 minutes (more precise once general area is known)
Complementary Use
In practice, I often use both methods together:
Quick Infrared Scan: Identify potential problem areas
Focused Ultrasonic Check: Confirm and locate specific discharge points
Detailed Infrared Analysis: Document and quantify the issue
This combined approach leverages the speed of infrared with the precision of ultrasonic detection.
Remember, while infrared generally detects discharge faster, the best approach often involves using both technologies. Infrared gives you the big picture quickly, while ultrasonic provides detailed, specific information. By mastering both methods, you’ll be well-equipped to handle any bushing discharge scenario efficiently and effectively.
Pro Tips: Optimizing Thermal Scans for Aging Transformers?
Are you struggling to get clear, actionable results from thermal scans on your aging transformer fleet? These pro tips will elevate your inspection game and help you catch issues before they become critical.
To optimize thermal scans for aging transformers: 1) Choose the right time of day, 2) Use proper emissivity settings, 3) Implement load correction techniques, 4) Utilize trend analysis, and 5) Integrate AI-assisted interpretation. These strategies significantly improve the accuracy and effectiveness of thermal imaging for older equipment.
Optimized thermal scan of aging transformer
After years of scanning aging transformers, I’ve developed these techniques to get the most out of every inspection. Let’s dive into the details:
1. Timing is Everything
Choose the Right Moment:
Scan during peak load periods for maximum thermal contrast
Early morning scans can reveal issues masked by daytime heat
Avoid Interference:
Wait at least 2 hours after rainfall
Scan on cloudy days to minimize solar reflection
I once discovered a critical bushing issue by re-scanning a transformer at 2 AM, when the thermal pattern was much clearer than during the day.
2. Master Emissivity Settings
Accurate emissivity is crucial for aging transformers:
Use emissivity tables for different surfaces
Apply high-emissivity tape for spot checking
Adjust for oxidation and wear on older equipment
Emissivity Cheat Sheet:
Surface
Typical Emissivity
New paint
0.95
Oxidized metal
0.60-0.80
Ceramic bushings
0.85-0.95
Oil-stained surfaces
0.70-0.85
Pro Tip: I always carry a small infrared-reflective aluminum target to double-check emissivity settings in the field.
3. Load Correction Techniques
Aging transformers often operate at varying loads:
This formula has helped me compare scans taken under different load conditions, revealing trends that would otherwise be missed.
4. Trend Analysis is Key
Single scans can be misleading; focus on trends:
Establish baseline scans for each transformer
Conduct regular scans (monthly or quarterly)
Use software to overlay and compare scans over time
Trend Indicators to Watch:
Gradual temperature increases in specific components
Changes in thermal patterns over time
Emergence of new hot spots
I’ve caught developing issues by noticing subtle changes in thermal patterns over six months that weren’t apparent in any single scan.
5. Embrace AI-Assisted Interpretation
Leverage technology to enhance your analysis:
Use AI algorithms to detect subtle anomalies
Implement machine learning for pattern recognition
Automate comparison of current scans with historical data
AI Benefits:
Faster analysis of large datasets
Improved detection of early-stage issues
Consistency in interpretation across different operators
After implementing AI-assisted analysis, we saw a 30% increase in early fault detection rates across our aging transformer fleet.
Advanced Techniques for Aging Transformers
Multi-Spectral Imaging:
Combine thermal with visual and ultraviolet imaging
Reveals issues invisible to thermal alone
3D Thermal Mapping:
Create three-dimensional thermal models
Helps visualize complex heat patterns in older designs
Drone-Based Inspections:
Use drones for hard-to-reach areas
Particularly useful for tall or remotely located transformers
Continuous Monitoring Systems:
Install permanent thermal sensors on critical points
Provides 24/7 monitoring and early warning
Correlation with DGA Data:
Compare thermal patterns with dissolved gas analysis results
Enhances diagnostic accuracy for internal issues
Overcoming Common Challenges in Aging Transformers
Reflective Surfaces:
Use angular scanning techniques
Apply temporary high-emissivity coatings when necessary
Complex Geometries:
Employ multiple angle scans
Use close-up lenses for detailed inspection of intricate areas
Insulation Degradation:
Pay extra attention to areas with known insulation aging
Look for unusual thermal patterns that may indicate insulation breakdown
Oil Leaks:
Scan during cool periods to detect warm oil traces
Use contrast-enhanced imaging to highlight small temperature differences
Cooling System Efficiency:
Compare thermal patterns of radiators and cooling fins
Look for uneven cooling that may indicate blockages or pump issues
Remember, optimizing thermal scans for aging transformers is as much an art as it is a science. It requires a combination of technical knowledge, experience, and intuition. By implementing these pro tips, you’ll significantly enhance your ability to detect and prevent issues in your aging transformer fleet.
Stay curious, keep learning, and never underestimate the power of a well-executed thermal scan. Your aging transformers may not be able to speak, but with these techniques, you’ll be able to hear their whispers long before they become shouts.
Conclusion
Thermal imaging is a powerful tool for detecting discharge in oil-filled transformer bushings. By understanding the technology, implementing proper techniques, and staying vigilant, maintenance teams can significantly improve transformer reliability and prevent costly failures. Regular scans and continuous improvement in methodology are key to long-term success.
Hello! 👋 Welcome to CHBEB.
We are a transformer manufacturer with 60+ years of experience.
✅ Distribution & Power Transformers (Oil & Dry Type)
✅ Customized EPC & OEM Solutions
✅ Fast Delivery & International Certifications